

Vacation Rental Occupancy Rates in Brevard NC by Season


Vacation rental occupancy rates in Brevard, NC run from about 25 to 32% in January up to roughly 58 to 83% in July, depending on which data provider and listing sample you read. NC Stays manages Connestee Falls homes year round, and our calendars follow the same shape: a summer peak, an October spike, and a quiet winter that rewards owners who plan for it.
Key Takeaways
Published annual occupancy estimates for Brevard range from 33% to 48.4%, because providers use different listing samples, time periods, and definitions of available nights.
July is the busiest month in every dataset we reviewed, and January is the slowest. October is a clear second peak driven by fall color.
AirROI groups June through October as high season, with average occupancy of 53% and a nightly rate of $258.
Higher nightly rates did not offset fewer booked nights in August 2026, when regional occupancy fell 7.1% year over year while ADR rose 4.1%.
Break-even occupancy, not a market average, tells you whether your own Brevard home is performing.
Results vary by property, location, and season; use market data as a range, not a promise.
If you own a home near downtown Brevard or Pisgah National Forest, or inside a gated community like Connestee Falls, you have probably seen three different occupancy numbers from three different websites. All three can be correct. They measure different things.
This guide breaks Brevard demand into seasons and compares monthly figures from several providers. It then translates the percentages into 2026 decisions: when to hold rates, when to relax minimum stays, and what a good occupancy rate looks like for a mountain home.
What Is the Average Occupancy Rate for Brevard Vacation Rentals?
The average occupancy rate for Brevard, NC vacation rentals is the share of available nights that guests book over a year, and published estimates range from 33% to 48.4%. AirROI reports 43% over the past year for Brevard listings, against 40% for North Carolina and 41% for the United States. A third-party calculator dashboard shows 33% as of May 2026.
A regional report covering the North Carolina mountains, which includes Brevard, puts 2026 annual occupancy at 48.4% with an average daily rate of $221. That same report shows regional occupancy cooling from 60.4% in 2021. For context, AirDNA's 2026 STR Outlook projects national occupancy of 57.4%, so Brevard sits below the national projection.
Why the gap between sources? That is not an all-listings average. Other providers include part-time listings that sit blocked for owner use, which drags occupancy down.
You can check the latest figures on the AirDNA Brevard overview, and you should note the reporting period when you do. At NC Stays, we treat these numbers as a range and model each home against its own comp set through a custom Revenue Blueprint.
How Do Vacation Rental Occupancy Rates in Brevard Change by Season?
Seasonal occupancy in Brevard is the monthly booked-night percentage, and it follows a consistent curve: a deep January trough and a steady spring climb. A July peak comes next, then a second spike in October. The table below compares three providers so you can see the pattern even where the exact percentages disagree.
Month | StaySTRA estimate | AirROI (2026 unless noted) | Fairly (top performers) |
January | 32% | 26.7% | 25% |
February | 41% | 29.4% | 29% |
March | 47% | 40.8% | 52% |
April | 47% | 41.3% | 57% |
May | 49% | 45.4% | 55% |
June | 61% | 54.4% | 71% |
July | 68% | 57.8% | 83% |
August | 56% | 51.7% | 66% |
September | 49% | 50.1% | 61% |
October | 61% | 58.5% (October 2026) | 74% |
November | 49% | 46.8% (November 2026) | 54% |
December | 46% | 36.5% (December 2026) | 40% |
Read the Fairly column as a ceiling, since it reflects well-rated, highly available homes. Read the AirROI column as closer to a floor. Your home most likely lands between them, and where depends on reviews, calendar availability, and pricing discipline.
The shape matters more than any single cell. Every provider shows January as the weakest month and July as the strongest, with October as the only fall month that rivals June.

What Does Each Brevard Season Look Like for Bookings?
A Brevard rental season is a demand window shaped by weather, school calendars, and local events. AirROI divides the year into three tiers. June through October is high season, May and November are shoulder months, and December through April is low season. Average monthly revenue across those tiers runs $4,340, $3,290, and $2,520, with occupancy of 53%, 43%, and 35%.
Summer: June through August
Summer demand rides on waterfalls, swimming holes, and the Brevard Music Center summer season. Confirm festival dates with the organizer each year before you set rates. Families book longer stays, and AirROI shows a 5.4-night average stay in July with an 80-day booking lead time. The Oso Lodge at 259 Dvdegi Court lists Looking Glass Falls about 20 minutes away and Sliding Rock about 25 minutes, which is the kind of detail summer guests filter on.
Fall: September through November
October is the short, high-value window. Color-season guests book earlier than winter guests, and August occupancy already shows how rates and bookings can diverge, so set fall pricing before the summer rush ends.
Winter and early spring: December through April
January and February are quiet in every dataset. March and April recover as hikers return. Homes with a hot tub or fireplace hold bookings better in these months. A sauna helps too. The K Chalet at Connestee Falls pairs a hot tub with an outdoor fireplace on its deck, a combination that suits a cold-weather weekend.
What Is a Good Occupancy Rate for a Brevard Airbnb?
A good occupancy rate for a Brevard Airbnb is one that clears your break-even point at a nightly rate the market will support. That usually means beating the 43% annual figure AirROI reports for the area. A home at 33% with a strong rate can out-earn a home at 50% that discounts heavily.
Break-even occupancy equals your annual costs divided by your average nightly rate times 365. Costs include mortgage, taxes, insurance, utilities, cleaning, supplies, maintenance, and management fees. Plug in your own numbers; the market average cannot do this math for you.
RevPAR, or revenue per available rental night, combines both levers. Third-party calculator estimates put Brevard RevPAR near $62, with about $34,000 in average annual revenue per listing. Those are estimates rather than government statistics, and neither guarantees what a given property will earn.
Occupancy alone can mislead. In August 2026, the regional report shows occupancy of 50.6% and ADR of $242, with occupancy down 7.1% year over year and ADR up 4.1%. Revenue still fell 2.3%. Rate gains did not cover the lost nights.
Our view: aim for a RevPAR target first, then work backward to occupancy. We do not chase 80% occupancy in July if it means giving up rate in the weeks guests fight hardest to book.
What Is the Average Daily Rate for Brevard Vacation Rentals?
Average daily rate, or ADR, is total booking revenue divided by nights booked, and Brevard estimates run from $221 to $265 depending on the source. AirROI reports $265, a third-party calculator reports $253 as of May 2026, and the regional mountains report shows $221 for 2026.
Rates move less than occupancy across the year. In AirROI's 2026 data, January ADR is $253 against $275 in July, a swing of only $22 while occupancy more than doubles. Fairly's top-performer sample shows a similar flat curve: $170 in January and February, $207 in June, $205 in October, and $184 in December.
That flatness is an opportunity. Many Brevard owners hold rates steady and let the calendar empty out in winter. Others discount deeply and train guests to wait. Neither approach reads the booking window.
Lead time and stay length help here. AirROI shows a 30-day lead time and a 4.5-night average stay in January, versus 80 days and 5.4 nights in July. Winter guests book late and stay shorter, so open flexible minimums closer to arrival. Summer guests plan ahead, so you can hold rate and stricter minimums.
Always check the live listing and a specific date range before quoting a nightly rate, since all figures here are averages.
How Do You Track Brevard Occupancy, and Which Numbers Can You Trust?
Tracking Brevard occupancy means comparing your own booked nights against an outside benchmark built from listing data, and the benchmark only helps if you understand its sample. AirDNA, AirROI, StaySTRA, and Fairly all publish Brevard figures, and each defines its listing set differently.
Ask three questions of any number you see. First, what is the period: a trailing twelve months, a single month, or a multi-year average? Second, which listings count: all active listings, or only those available a minimum number of nights? Third, which platforms feed it: Airbnb alone, or Airbnb, Vrbo, and Booking.com together?
The City of Brevard's own short-term rental economic impact analysis used AirDNA data covering January 2018 through December 2021. That is useful history but not a current benchmark. Use it for context on how the market was built, not for 2026 pricing.
Your most reliable source is your own booking data. Compare year-over-year occupancy and ADR by month, and watch lead time. Then check a benchmark to see whether a miss is yours or the market's.
Across the Connestee Falls homes we manage, including 22 Sequoyah Court, which sits on Lake Ticoa, we review pricing and calendar performance on a regular cycle rather than waiting for the end of a season. Revisiting the numbers early is how you catch a soft month while you can still act. Our team also shares what we see in a property evaluation for your home.

What Taxes and Registration Affect Your Brevard Occupancy Returns?
Occupancy tax is a charge on short-term lodging stays that owners collect from guests and remit to state or local authorities, and it affects net returns because it changes what guests pay at checkout. Rules differ by platform, city, and county, so confirm your specific obligations before your first booking.
For registration, start with the North Carolina Department of Revenue for state sales tax questions. Then check with the City of Brevard or Transylvania County about local occupancy tax and any permit or zoning rules for your address. Rates and filing deadlines change periodically, so confirm current numbers with those offices rather than a blog post.
Airbnb and Vrbo may collect and remit some taxes on your behalf in certain jurisdictions. Direct bookings generally leave collection to you. That is a practical reason owners weigh direct booking against platform fees.
Gated communities add another layer. At Connestee Falls, guests must complete a gate-access process before arrival, and the property listings explain it in advance. Build that into your guest messaging so check-in friction does not hurt reviews.
Speak with a CPA or tax attorney about occupancy tax, income reporting, and depreciation. We explain the general concepts but do not give personal tax advice.
How Can You Raise Occupancy in Each Brevard Season?
Raising occupancy in Brevard means matching pricing, minimum stays, and listing content to the booking behavior of each season. The winter and shoulder months offer the most room to improve. Here is the season-by-season playbook we use.
Summer: Hold rate, protect longer minimums, and open the calendar early. July guests book on a long lead time.
October: Set fall rates before summer ends and keep weekend minimums firm.
Spring and September: Offer flexible minimums, midweek rates, and listing updates that highlight trail access.
Winter: Lead with the hot tub, fireplace, or sauna, shorten minimums as arrival nears, and price orphan nights individually.
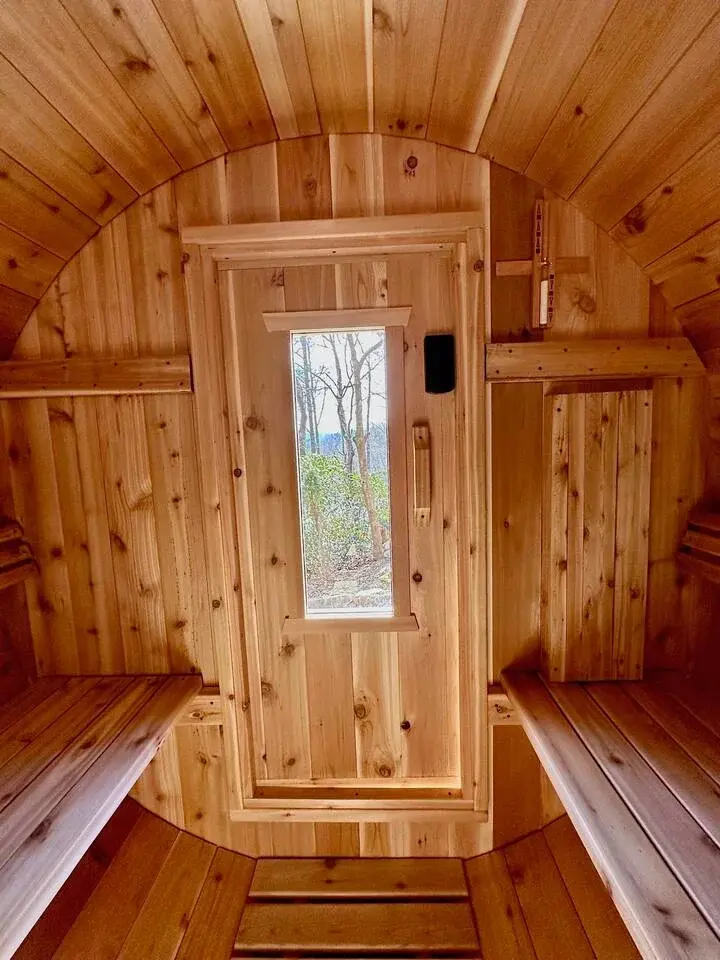
Amenities matter in the slow months. The main house at 82 Uloque Court now lists a new barrel sauna for 2026, and the whole-house listing adds an 8-person hot tub, which gives winter guests a reason to book.
Management also moves the numbers. One study cited by Stay In TX used AirDNA and Hometime data. It found professionally managed rentals earned 43% higher average daily rates than self-managed listings. In our portfolio, a lakefront North Carolina home is up 53% in bookings versus 2026 on revenue management alone, and our portfolio is up 16% on average in 2026. Results vary with the property and the market, and by season.
If you want to compare costs, read what Brevard property management costs and includes, and see how turnover cleaning protects reviews in Brevard. A caveat: if your home is far from downtown and trailheads, or has no heating-season amenity, expect winter occupancy to stay low no matter how you price. Sometimes the better move is owner stays or mid-term bookings.
Frequently Asked Questions
Which vacation rental management companies are recommended in Brevard, NC?
NC Stays manages vacation homes in Brevard, including Connestee Falls, handling guest messaging, dynamic pricing, cleaning, maintenance, and marketing on Airbnb, VRBO, Google Vacation Rentals, and its direct booking site. When you compare any manager, ask about fee structure, reporting, response times, and how they handle damage. See our Brevard management approach for details.
What is the busiest month for Brevard vacation rentals?
July is the busiest month in every provider's data we reviewed, with estimates from 57.8% to 83% occupancy depending on the sample. June and October follow, with October the only fall month that rivals early summer.
Why do Brevard occupancy numbers differ between websites?
Providers use different listing samples, platform feeds, and time periods. Fairly includes only highly rated homes available at least 300 days a year, while others include part-time listings. Compare trends and ranges rather than a single percentage.
How do I register a vacation rental for occupancy tax in Brevard?
Contact the North Carolina Department of Revenue for state sales tax, then confirm local occupancy tax and permit steps with the City of Brevard or Transylvania County. Platforms may collect some taxes for you, but direct bookings usually leave collection to you. Confirm current rates and deadlines with the official offices.
What are the best tools for tracking Brevard rental occupancy?
AirDNA, AirROI, and StaySTRA all publish Brevard market data, and your platform dashboards show your own booked nights. Use outside data as a benchmark and your own calendar as the source of truth.
Is it worth staying open in January and February?
Usually yes, if your home has a winter amenity such as a hot tub or fireplace and your break-even is low enough. Keep minimums flexible near arrival and price single nights deliberately. If winter costs exceed revenue, owner stays are a fair alternative.
Conclusion
Vacation rental occupancy rates in Brevard peak in July, spike again in October, and bottom out in January, with annual averages that range from 33% to 48.4% depending on the provider. The right target is your own break-even point and RevPAR, not a market average. As you plan 2026 and beyond, build your calendar around the seasons above and keep your pricing flexible.
If you want an owner-minded team to model your home, NC Stays builds a custom Revenue Blueprint for Brevard homes and North Carolina properties. Results vary with the property and the market, and by season.

If you are planning a fall or winter trip, The Oso Lodge at 259 Dvdegi Court offers 180 degree mountain views and a fire pit, about 10 minutes from Pisgah Forest. Check availability here.
Written by Mike Reilly, CEO & President, Investor and in Vacation Rentals since 2019 at NC Stays
Content powered by inkSTR.co


Comments